I’m continuing the series of articles about developing a Geo Information System for 2GIS company.
In the first part of the series I described the user requirements for the Geo Information System we were developing, and in the next part – an overview of the architecture. Here I’m describing in more details how we dealt with map navigation.
While working, a cartographer moves around the map like crazy! They zoom out and pan, and zoom in, and pan, and pan again. We calculated that on average, a cartographer sees on a screen up to several megabytes of geo data. Sometimes they see several hundred of thousand of geo objects at once. And they move every second, loading new data.
For this part of the system we had, probably, the most strict requirements than for any other part of the system.
Map load must be fast. Really fast. No slower than the old system, and preferably even faster. For every cartographer, in every office of the company, even in the most remote ones with a bad internet connection.
A geo object, just created by one cartographer, must appear on the other cartographers’ screens almost immediately. It’s not a social network, where your friends will see your update in several minutes. This was a professional system for busy people who couldn’t lose any time :). Remember, they have less than 10 seconds to deal with one geo object? These ten seconds include moving around the map to find the place.
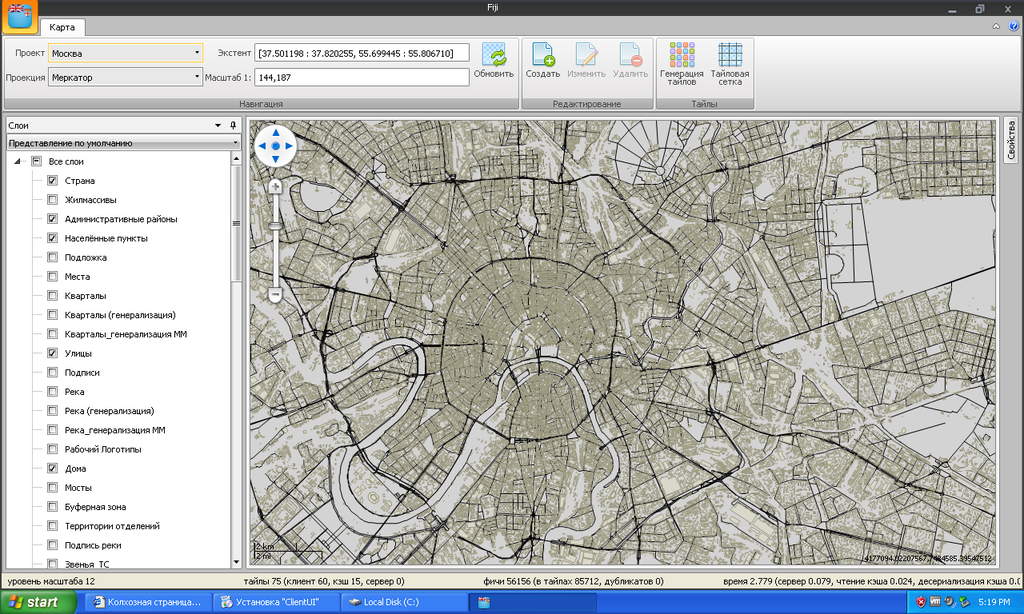
First approach: direct query
Obviously, the first approach was to just query geo objects directly from the database. We could load geometry which intersects the current screen “geometry”.
We stored the data in a Microsoft SQL Server database with spatial extension. Geometry was stored in a spatial column (geometry type). It has a spatial index on it, allowing you to query the data quite fast. So it seemed like a valid approach. The old system worked that way, and everything was fine.
But there was a caveat about the old system. It was installed separately in every city (where the company had an office), and supported only an area up to 100×100 km. This way, it didn’t have to hold too much data – only a single city. Also the access to the database via the local network in the office was blazingly fast. And finally, each office had only several people who use the system at the same time.
For us, this approach just didn’t work anymore. First, our main server with the database could be only in one place. If you were in a different city, all the way across the country, or even in a different country, ping times could be, say, 300ms. It wasn’t acceptable. Imagine that every time you scroll this article, it takes 300ms to refresh.
Second, we had the map of the whole world. Several hundreds of cartographers, frantically moving around the map, would load the database too much.
This we could solve with some smart replication. We could create database slaves to query from. But even if we had a separate slave for each and every cartographer, the query speed wasn’t enough.
So, as the straightforward approach didn’t work, we had to come up with a different idea.
Second idea: raster tiles
A different idea was born right away. What if we use tiles? Raster tiles, like Google Maps? The images would be small, the load times would be tiny, and the database wouldn’t be hurt. We’d store them separately, maybe we’d have in every city a small server with tiles specifically for that city, so it could serve the images fast enough. We’d have tiles for several zoom-levels for different scales, like Google Maps do, and we’d make them easy to query by row and column. We could name them: “Tile-zoomlevel-row-column”, for example: “Tile-3-2-1”.
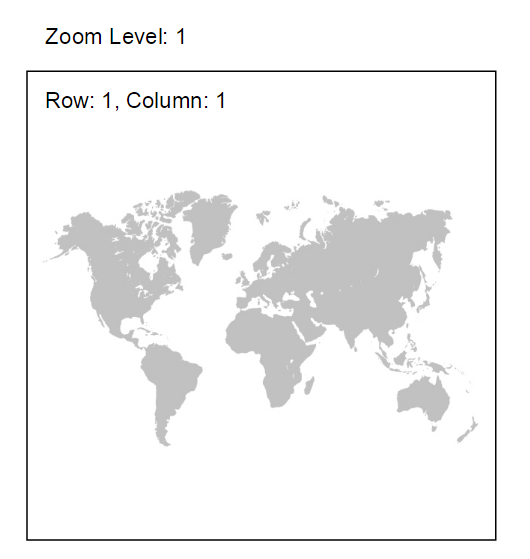
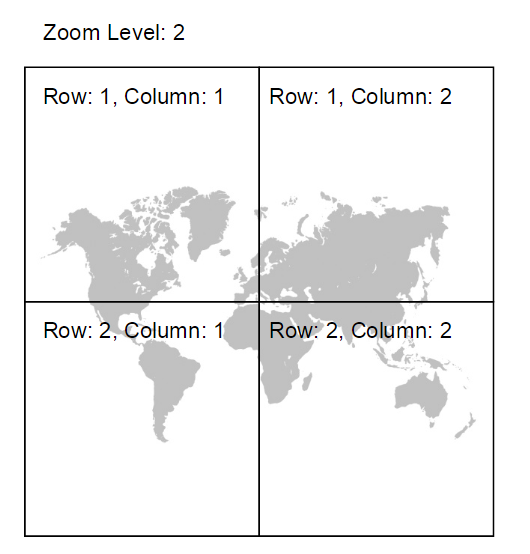
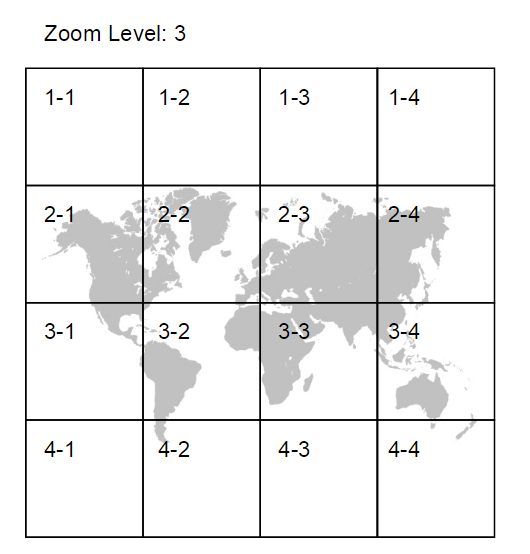
But, of course, it couldn’t be that simple.
Cartographers wanted to turn layers on the map on and off at will. Say, one person wants to see buildings and rivers, and another – roads and metro lines. Raster tiles, like Google Maps’ ones, have everything on them at once.
What if we made them transparent, thought we. We toyed with this idea for some time, thinking it through. It seemed nice to have a separate tile for each geo class, load only needed classes, and then draw them on the client. “Building-zoom5-row37-column48”. “River-zoom8-row10-column3”.
Then we remembered that each and every cartographer wanted to color the layers of geo objects in their own way. Someone wanted pink buildings on black background. Someone else wanted their buildings light blue and checkered. A third person was color blind and wanted their unique color scheme.
The developers gathered to have another brainstorm.
“Whaaat iiiif”, said one developer slowly, “we could color that raster images on the client?”
“Noooo”, said the other even slower. “If one user wants semi-transparent fill and dotted border, and the other – solid border with checkered fill, we can’t support that.”
“Also”, said the third developer, “I remember that they wanted to display attribute values on the map. Imagine you want to label a house with its number.”
“Speaking of attributes”, said someone”, “they wanted to filter out specific geo objects from display, based on attributes. For example, show all houses higher than 5 floors.”
“And”, said someone else, “they wanted to be able to set any scale they like. We can’t do that with raster tiles. They’ll be forced to work with only those scales that zoom-levels provide. 15 zoom levels – 15 available scales. That’s very limiting.”
We went silent for some time. We can’t solve this. It’s hopeless. Our new system is never going to be fast and convenient to use. We started to picture being fired and never being able to find a new job.
And then we came up with an ingenious idea. Let’s do vector tiles!
Winning idea: vector tiles
So we did.
We cut the whole world in squares. We cut each and every geo object according to those squares. We stored them in the same way as we would do with raster tiles, very easy to query by row, column and z-level. We put every geo object type into its own layer of tiles: buildings into Buildings tiles, roads into Roads tiles. This way we almost magically solved every problem we had!
Having vector geometry, we can color it on the client in any way the users want, and we can display any combination of layers in any z-order.
Vector tiles can be zoomed easily, to make them fit any scale. For example, a raster tile with zoom level 14 matches only scale 1:72223. But a vector tile can serve whole a range of scales from 1:72223 to 1:144447, and not just one single scale.
Unlike raster tiles, vector tiles can tell you which object you just clicked. Or which objects, if you happen to click on a place where there’s more than one.
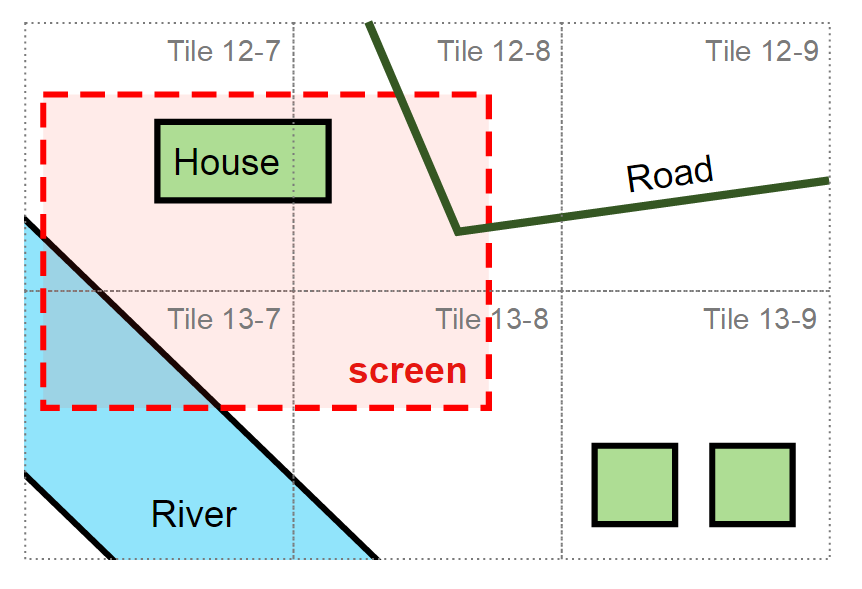
And we put attributes in the “attribute tiles”. If the geometry of a given geo object goes into a tile Building-Geometry-37-48, then the “height” attribute goes into a tile Building-Height-37-48. This way we can solve two problems at once: we can display attributes on the map, which is called labeling, and also we can filter geo objects based on these attributes.
We kept a cache of these tiles on small servers in each city where the company had an office. Since a server was located in the same office building where cartographers from that city are working, the network delays weren’t a problem.
More details
The idea was a very nice one, but there were so many things to solve…
Serving a tile
When a client requests a tile from the tile server for the first time, the tile server forms the tile, cashes it and gives it to the user.
If a client requests the existing tile, the server just gives it. It’s much faster than to form a tile first.
Of course, when a server first starts, it doesn’t have any tiles at all. That’s why we created a special starting procedure that would pre-generate all tiles for the city. This way, the “give-the-existing-tile” procedure happens almost all the time.
Quite rarely the cartographers move, say, to another city to help their colleagues, or just out of interest. They’re curious guys. This is when the first procedure happens, when the server has to form the tile first. It’s much slower, and cartographers start to complain. But you can’t make everyone happy all the time.
Updating a tile
If a cartographer creates a new geo object, naturally, all other cartographers want to see it on their screens right away. If a cartographers deletes an object, they want to see too. As I said, they’re a curious bunch!
If tiles are just lying there in the tile server, pre-generated on the start, then they won’t have that new object, and the fellow cartographers will be upset.
To make them smile more, we created a constantly-running job which checked if there’re changes in the master database and refreshed the needed tiles. Each tile bore a timestamp, which we compared with the database timestamp.
In a tile, all geo objects were sorted by ID, so it was easy to find the one to update or delete.
Updating a tile for the most impatient
The time of the tile update was just a couple of seconds, and the fellow cartographers were happy with this. But the guy who created the geo objects was not!
He or she has created an object, saved it, moved the map, saw the loaded tiles, and their object was not there! They couldn’t waste a couple of seconds just to wait until it appears.
So we had to keep that new object in memory on the client. We “injected” it into the map, until the tiles with the newer timestamp were served. Of course, it had to undergo all the same coloring, labeling and filtering procedures as objects in tiles do. The difference was – older objects already were in tiles, prepared to be displayed, like baked beans in a tin can. For the new objects we had to “bake” them on the fly.
We spent quite some time in development to “inject” such objects and properly “discard” them when the new tiles are ready. But in the end it worked seamlessly, and cartographers were unaware about all this.
Personal coordinate system for each tile
The tile loading was fast, but the speed, with which the map engine displayed the geometry, wasn’t enough. What could we do about that?
The map of the whole world requires us to store coordinates in 16-byte pairs: X’s and Y’s, both 8-byte doubles.
But a tile is a small piece of the world. Couldn’t we somehow use this to optimize things?
Yes, we could! 🙂
Every tile had a small “coordinate system” of it’s own. Basically, a tile is a square of 256×256, which makes X-part of the coordinate equal to byte, and Y – guess what – one byte too.
Just like that, we have won 14 bytes per coordinate, 8 times less space. A tile, containing 100 points, originally takes up approximately 1.6 kilobyte. And with this optimization it shrinks to measly 200 bytes – a massive eight times win!
Further geometry simplification
We understood that we can “simplify” geometry and remove points and even whole geometries that are not distinguishable on a current zoom level.
The 256×256 coordinate system makes it incredibly easy to do. If two points after this discretization are equal, just remove one of them.
If the whole geometry becomes one point, remove it completely.
For example, what happened to buildings?
On zoom level 1 (the whole world map on the screen) we don’t display buildings at all. Same goes for zoom levels 2, 3 and further.
On zoom level 10 (one city on the screen) we start to display buildings, but only as single dots, and we remove duplicating dots.
On zoom level 13 you can see almost everything, but still, we remove points that on this scale are being displayed as one.
On zoom level 15 we display everything.
On smaller zoom levels, we managed to decrease the tile size immensely: sometimes, from “raw” 1 megabyte to 150 kilobyte-tile.
Borders
Imagine you have a geometry that belongs to two tiles, intersecting their border. Then imagine you want to display it on the map with a thick black border and a green fill.

You load two tiles, you get the geometry from them and display it right away.
Guess what? Your geo object has a thick black line in the middle!

It’s because your drawing engine doesn’t know that your two geometries are actually a part of one.
We tried to “sew” them back with geometry operations, but it was too slow. So we decided not to draw the border piece that goes directly through the tile edge.

But if the geometry genuinely had points on the tile edge, we’d insert them twice in the tile. This way we had a kind of a marker. In this case, we would draw that line.

Tiles are only for display
I need to emphasize that we use vector tiles only for display. They are heavily optimized specifically for that one and only purpose. That’s why they’re so good :).
For other purposes, like searching for an object, or editing an object, we have other specialized services, and you can read in this article all about them!
There was a question from one of the readers: how do users edit the geometry? Especially when it’s cut into pieces?
When they click on an object, we determine from the tiles an ID of that object. And then we load the full object from the server and display the vector editor and the form for attributes. So we always have a complete object to edit, not cut and not simplified.
By our cartographers’ technology, a geo object is a very holistic thing. Geometry is important as much as attributes, and attributes are as important as the location of that object among other geo objects. When you edit an object, you edit all of that, validate and save all of that at once. Besides that, users often edit many objects at once and save them in bulk.
If your current screen position includes only half of the tiles an object belongs to, you obviously can’t edit it “holistically”.
If you’re in a smaller map scale with simplified geometry, you can’t edit it too.
Attribute tiles don’t contain all attributes – only those needed for display.
That’s why it’s cheaper, easier and more reliable to load an object from the Map Server, even if you already have some parts of it in tiles.
Вот плохо, когда две команды работают над схожими проблемами в разных офисах 🙂
У нас в terramap’е те же проблемы были, однако решались несколько иначе. Например, мы явно хранили “внешние” рёбра.
Получается, что неудвоенные точки на границе считались служебными, не были доступны в режиме редактирования и автоматически пересчитывались при перетаскивании одной из двух реальных точек ребра? И, получается, для редактирования объекта на стыке обязателен соседний тайл, чтобы найти эти самые вторые точки?
В terramap’е листья хранятся “внахлёст”, чтобы не добавлять дополнительных точек. В вашем случае это бы тоже сработало, тогда не требуется второй тайл и можно редактировать часть объекта. Впрочем, да, требуется предварительная загрузка небольшого дерева с bbox’ами листьев.
Как разрешаются конфликты? Например, мы начали редактировать, а тут прилетело обновление тайла с изменением данного объекта. Могут ли два человека одновременно редактировать разные части (грани) одного и того же объекта?
Не, можно без дерева, чтобы не париться с его обновлением. Просто всегда загружать на один тайл больше во все стороны.
Привет, Данил :))
Очень приятно, что ты прочитал и даже прокомментировал!
Наши тайлы используются только и исключительно для отображения. Когда картограф кликает в объект для редактирование, объект загружается целиком с сервера (из мастер-бд). Конфликты, таким образом, решаются мап-сервером в момент сохранения, и это даже не мерж, это просто optimistic lock. Два человека не могут редактировать один объект.
Почему так? Не было такого требования, чтобы они могли. Объект – это целостная штука, в которой все части важны, связаны между собой и зависят друг от друга. Геометрия, атрибуты, и даже расположение относительно других объектов – все это редактируется, валидируется и сохраняется разом. Даже если мы возьмем редактирование только геометрии, без атрибутов – оно включает в себя не только перетаскивание отдельных точек, но также и перемещение (всего объекта разом), вращение (всего объекта) и т.п. Также пользователи очень часто редактируют несколько объектов разом и сохраняют в одной сессии.
Получается, что гораздо проще и надежнее всегда загружать объект(ы) целиком, а также не давать одному картографу перезаписывать изменения второго, которые первый не видел.
Про тайлы. Почему тайлы используются только для отображения? Есть много причин.
В тайлах есть не все атрибуты.
Если геометрия “простирается” на несколько тайлов, а мы видим только часть из них, это неполный объект, он непригоден для редактирования.
Генерализованная геометрия в мелких масштабах, конечно же, совершенно не подходит для редактирования.
Мы использовали геометрию в тайлах только для притяжки. Для этого кейса нам действительно нужна только видимая часть геометрии. Одинарные точки на границе мы пропускали, удвоенные использовали; генерализованную геометрию не использовали вообще. Считаем, что если ты находишься в масштабе, где геометрия определенного класса уже генерализована, то ты не хочешь к ней притягиваться, т.к. слишком мелко.
Также мы использовали тайлы для определения, в какое место кликнул пользователь. Тут тоже достаточно только видимых частей, если исключить генерализованные тайлы. В результате клика мы, конечно, загружаем полный объект для редактирования.
…пожалуй, надо все это добавить в статью. Спасибо за вопросы!
А можно где-нибудь прочитать немного подробнее про ваши “листья внахлест”? Не уверена, что правильно поняла идею.