I’m starting a series of articles about building a geographic information system, or GIS-system. With a great team of smart and very dedicated developers, we created a robust scalable solution that our users were happy with. Or, almost happy. You can never make users completely happy. Sigh.
We developed it for the great company 2GIS, where I got a lot of experience and learned tons of things.
In this first article I’m going to tell you about user requirements we gathered before we rushed into development.
How it all started
Everyone is used to maps nowadays. Uber shows you a tiny car on a map, while you wait for the driver to pick you up. Google Maps tells you how to get from your home to your work on a bus. Flight booking companies show you flights from your city to any place around the world – just pay! Fancy shopping malls offer you apps with locations of all fancy boutiques. Your car navigator guides you through unknown – again, through a map.
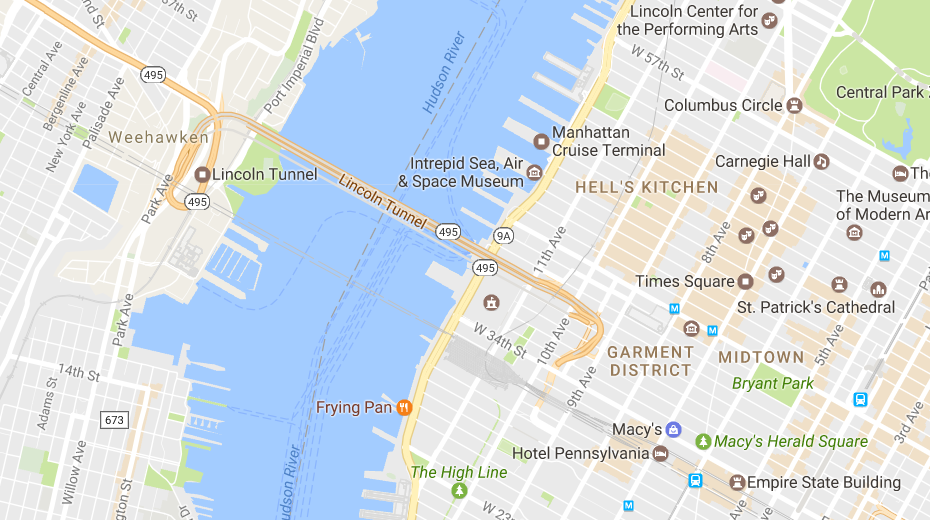
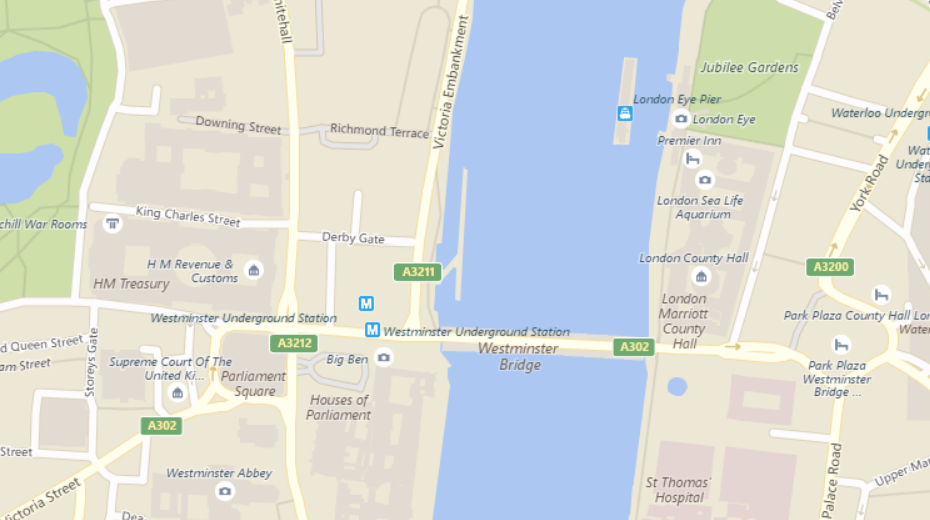
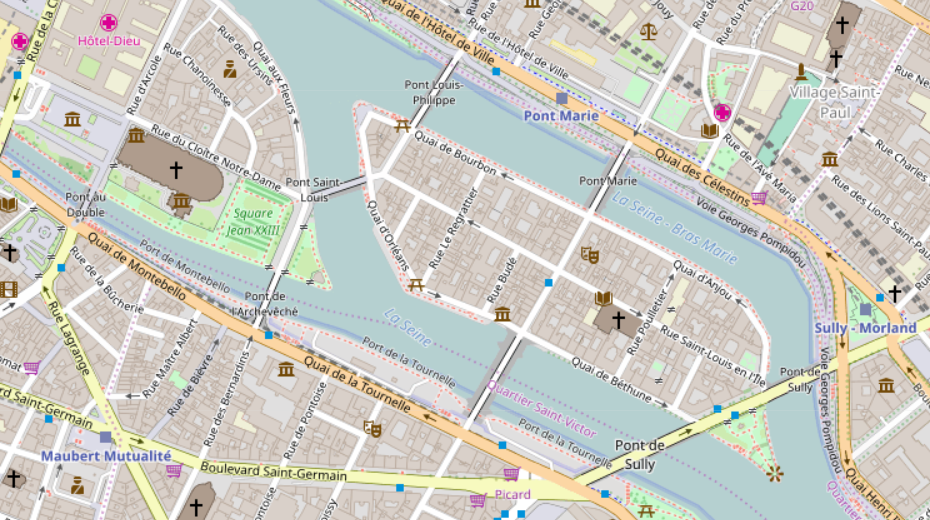
But imagine you live in Siberia in 90’s. There’re no Google Maps, no Yandex Maps, and no Bing Maps. No TomTom. And certainly no OpenStreetMaps.
There’re only paper maps. You know, paper, the flat rustling thing. You don’t know where to go, you unwrap it on the street, it’s windy and cold (-30°C is perfectly normal in winter). And it still doesn’t tell you which bus to take. And where in the hell are you, anyway?
That’s why a company called 2GIS was formed, and they decided to make a map-for-computers in their home city, Novosibirsk, in the heart of Siberia.
Later it grew into a big mapping company with thousands of detailed city maps, online maps, offline maps, maps in apps, and even maps of shopping malls.
Geospatial technology
There’re many professional technologies, like metallurgy, or food technology, or chemical technology. They all define complex processes of manufacturing a certain product.
Maps producing technology is no exception.
Our cartographers were all highly skilled people, and they had a unique and very specific technology of working with maps. It took them many years to bring it to perfection. Only by following and constantly improving their technology, they managed to reach an incredible speed of data creation and amazing data quality.
The company’s standard was – 90% of true and reliable information in every city. In many cities, they reached 95% and more.
All maps are very detailed. They show you all buildings, building entrances, and what companies works in each building, with phone numbers, website addresses and working schedules. You can see all roads, metro lines and metro exits, train stations. Parks, statues in parks, and fountains. With names. And sculptors’ names.
…bus stations. Bus numbers, bus routes and schedules. Road directions and what maneuvers are allowed on that nasty complex crossroad without streetlights. Road signs.
This precision and this level of details is impossible to reach without lots of manual work of many professional cartographers, elaborate technology, and a few know-hows.
The data itself, and data quality, was of great importance for the company.
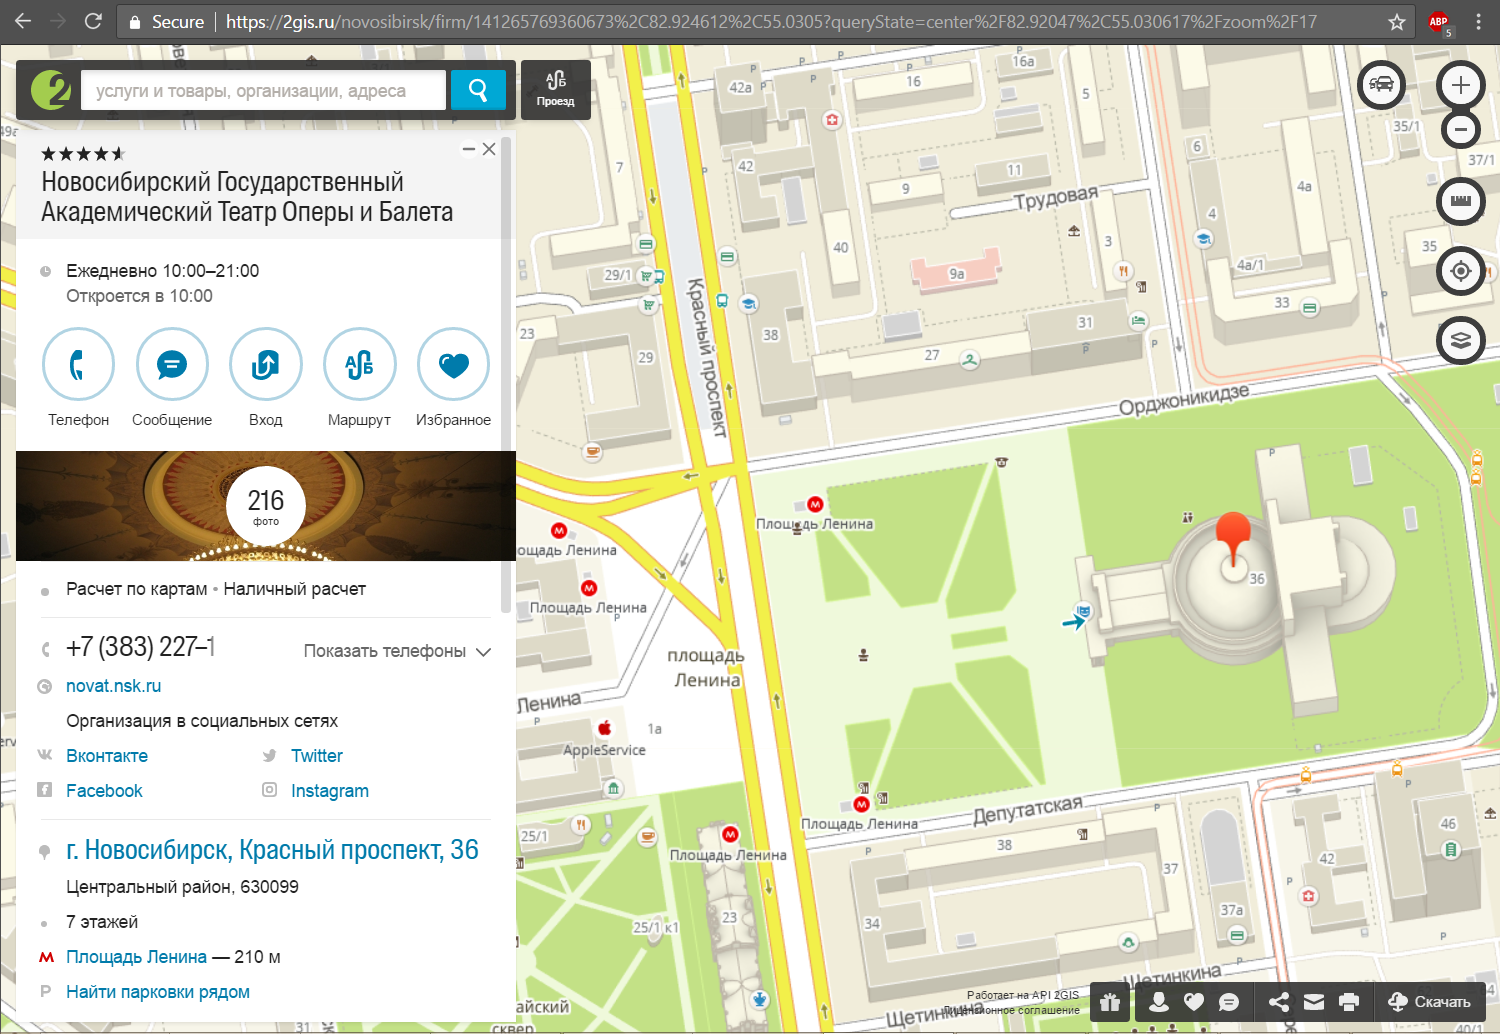
For many years the company used to make detailed maps of cities in Russia and abroad. The time has come, when they started to think about moving further and creating a map of the whole world, with the same precision and level of details.
There was an existing geo system in the company, on which many of us, developers, have worked before. A separate instance was installed in each company’s office. It had two-tier architecture: a database and a rich client.
The old system was built a really long time ago, somewhere in the middle of 90’s, and it was still working nicely. But because of technical limitations it couldn’t support areas greater than 100×100 kilometers. It was okay for the map of one city, but of course, the whole world is a bit bigger than that. The old system wasn’t scalable, and it had other limitations, not solvable within its architecture.
Still, while working on the old system, we learned a lot. It was polished and tweaked over the years to match our users’ very specific needs and wishes.
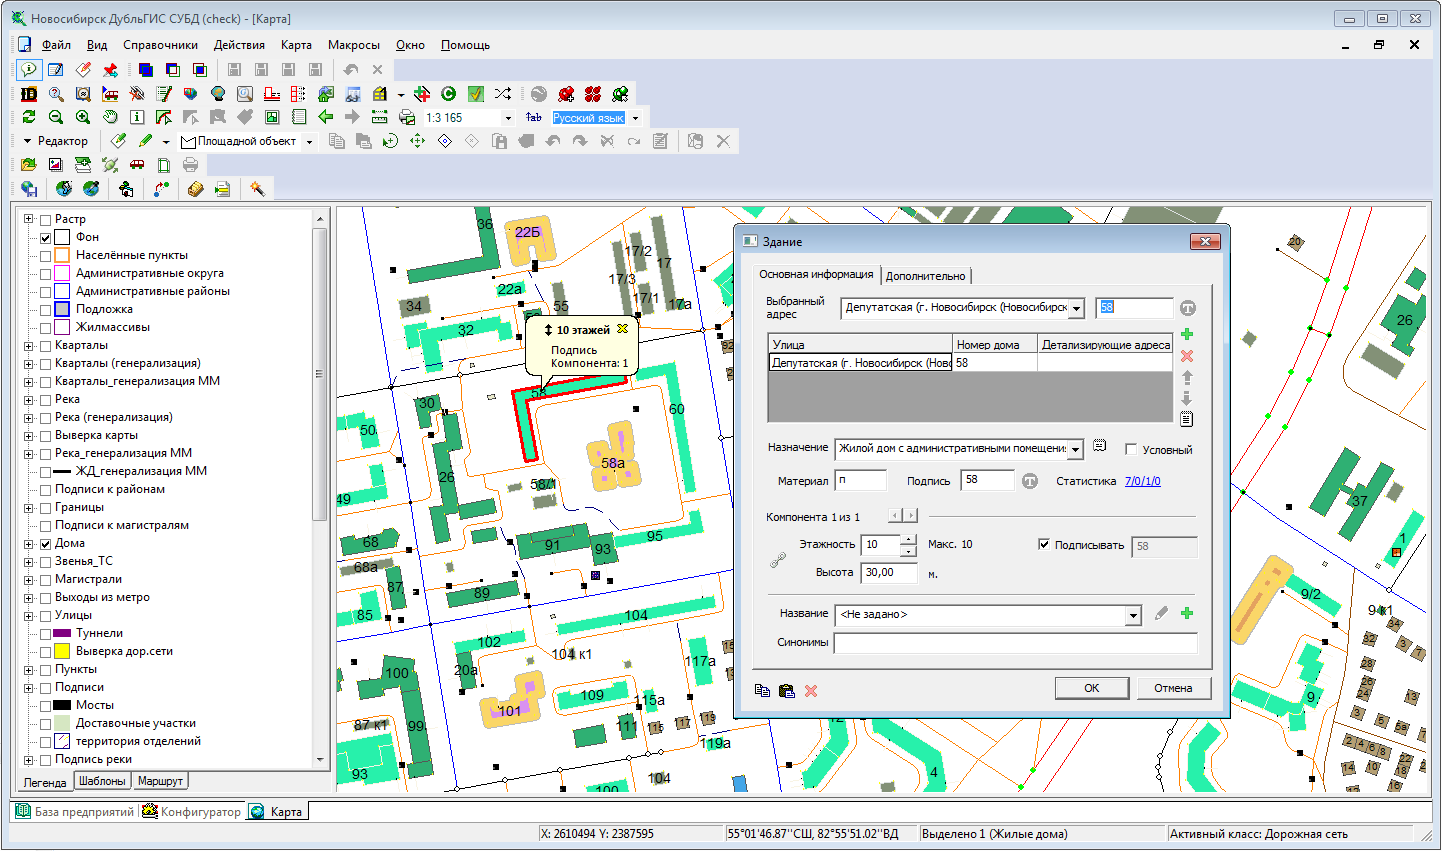
Of course, it was very important for us to completely support their technology and to provide them with all tools they needed.
And, of course, since they greatly extended their technology in order to create a map of the whole planet, we had to support the new requirements too.
Us
We were a team of software developers. Some of us have been working in the company for several years already, and already knew a lot about GIS and our users’ technology. Some have just started. But we all were very interested in this project. Seriously, can you find something more exciting to work on?
Our users
Our users were several hundreds of professional cartographers – people who create the map, draw polygons for buildings and lines for roads. They sat in 100+ offices all around the world, and each office was responsible for the map of their own city and surroundings.
A cartographer’s typical amount of work was to create and edit up to 3000 geographical objects per day.
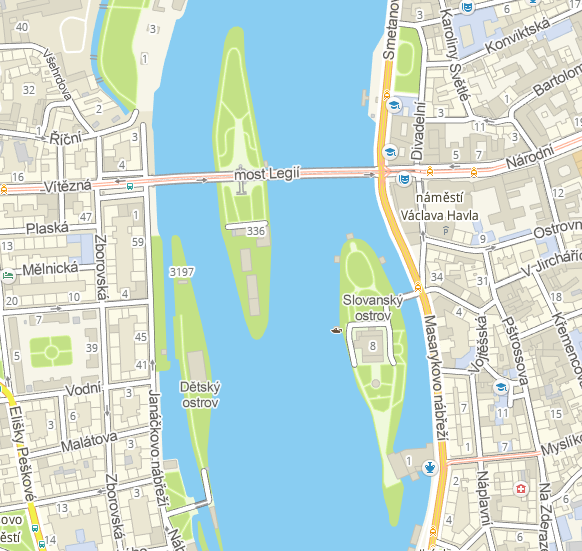
You’re probably thinking: is it a lot? Is it a big number?
Let me put it this way.
If you work 8 hours per day, don’t drink coffee, don’t talk with your colleagues, don’t watch youtube videos, then each geo object will get 9.6 seconds of your attention. Less than 10 seconds to pick a place, select the right tool, draw a geometry, fill attributes, save. Repeat.
Manhattan has about 60 000 buildings. To create a full and detailed map of it, a team of 20 hard-working cartographers would take just 2 days.
Our data
These buildings would all have an address, sometimes several addresses, a height, a postcode, a type, and other useful attributes. Of course, the geometry can be complex, if a building has several parts and a beautiful shape, born in the brilliant mind of an architect. Overall, a single geo object in our system can be as big as several hundreds of kilobytes.
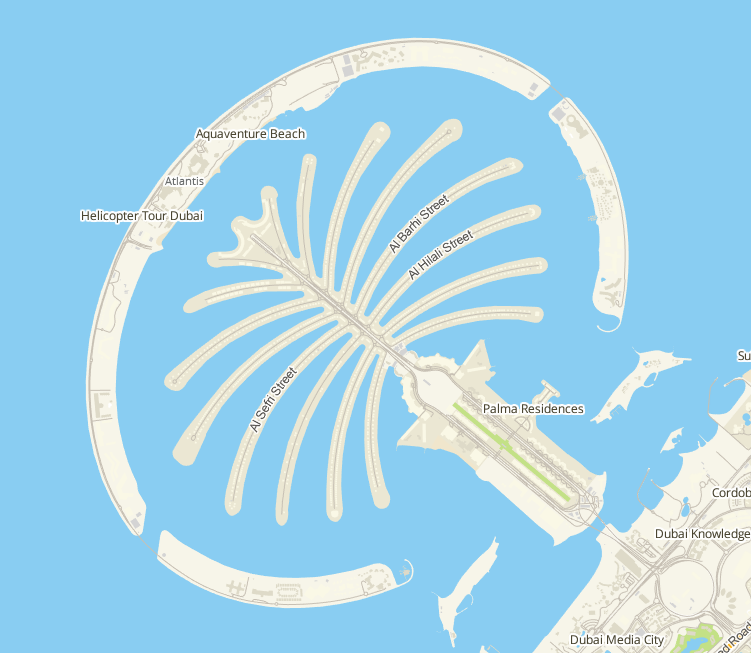
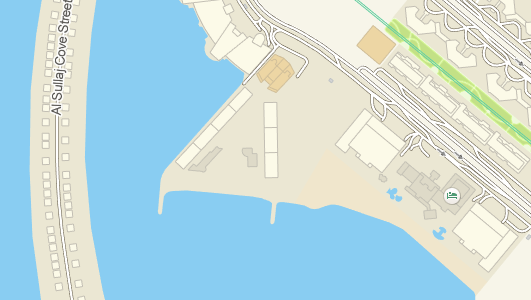
500 cartographers, each working hard, can produce more than 70 gigabytes of data per day. They don’t do it every day, all the time, but it was the load we had to support.
Now, that’s something, isn’t it?
This data has to be stored. And it has to be displayed on other cartographers’ screens almost immediately, so that they could see what other people are doing.
All this data is not static. It’s living. and actively changing. When a geo object is created, it doesn’t just sit there idly forever. Someone updates it several times a day. Someone moves it to align with other geo objects, edits its attributes, splits it into several independent objects or merges again. The map is alive!
A geo object can belong to one of many types, such as: buildings, roads, rivers, metro exits, etc. Cartographers define these types at their will, according to their technology. To each type they add attributes and rules to ensure the validity of objects in the class, and thus the data quality.
Sometimes users search geo objects by attributes. For example, they want to find all buildings in Manhattan with >5 floors, with areas <50 square meters, created between March and May last year.
And we can’t lose any of this precious data. It’s hard work, and all of it is valuable.
Moving around the map
While working, a cartographer moves around the map like crazy! They zoom out and pan, and zoom in, and pan, and pan again. Usually, cartographer sees many geo objects at once. We calculated that on average, a cartographer sees on a screen up to several megabytes of non-compressed geo data. And they move the map all the time, loading new data every second.
This part of the system required special attention. They do it all day, so it has to work flawlessly, the map should load really fast. Imagine that every time you scroll this blog page, it takes a second to refresh. It would be really annoying.
Limitations
The company had limited resources. It couldn’t buy many servers, hire an army of developers, or buy ArcGIS licenses. We had to be really conscious about all our decisions.
Requirements analysis process
To learn more about what our users wanted, we talked with them, watched them work, logged their actions in the old system, and conducted a thorough system analysis. Also we applied our experience in working with that older system.
We also investigated existing geo information systems. Some of them were way too expensive, others were not scalable enough, third ones couldn’t be customized very well.
In the end we decided to build everything ourselves. So, we had to create the system that would support the map of the whole world. With the volume of data I just described. With convenient UI to help our cartographers create maps faster. It mustn’t be slower or have less functionality than the older system.
It sounded like a very interesting project!
UPD: Architecture article is now released!
UPD 2: Now you can read in more details about map navigation.

I seriously love your website.. Very nice colors
& theme. Did you create this site yourself? Please
reply back as I’m trying to create my own blog and would
love to know where you got this from or just what the theme is called.
Thank you!
Hey Jim,
Thanks! This is WordPress with the theme Twenty Sixteen. I believe it’s one of the default ones.
Good luck with your blog!