
This article is based on my conference talk about A/B testing – check out the slides.
What is A/B testing, anyway?
Let’s imagine you own a webpage for selling flowers, and you have a red “buy” button in there.
Now let’s imagine your new designer tells you: hey, green buttons are a new trend in the flower selling industry. People like green more than red, red is aggressive, green is soft and persuading. Green button will be more visible on the page. Let’s make it green.
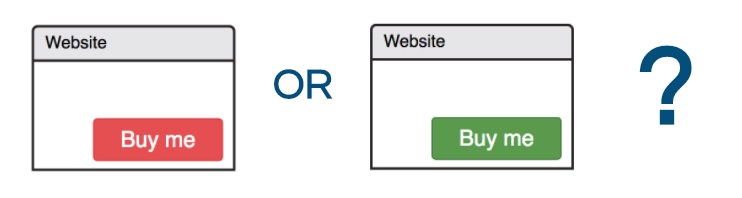
But you like red buttons. You think red is the best color in the world. It’s very bright, straight to the point, it pops up and calls you to buy some flowers for your significant other.
The question is: how do you two agree?
Do you trust your designer enough to let them do this risky change? What if you are right, and the red button is better? What if they are right, and you are missing on an opportunity?
Let the users decide!
With the A/B testing approach, you don’t have to argue which button is the best. You simply let the users decide!
In a case like this you can set up an A/B test, also called an experiment.
Think of it as of a sports game. You let the buttons compete for your users. Which button is the fairest of them all? For which button do the users implicitly “vote”?
You let 50% of visitors see your favorite red button, bright like a rose 🌹.
And the other 50% of them will see the green button, gentle like a leaf 🍃.
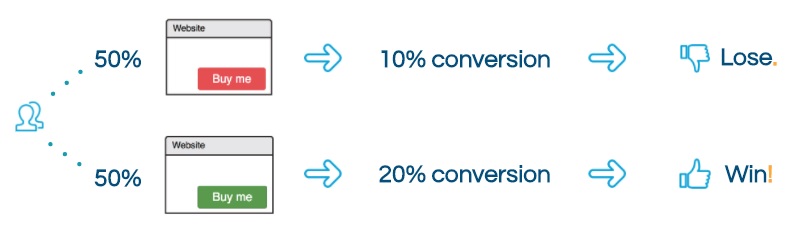
You set this up and you watch for a while. You log how many people visit your page, and how many buy your flowers, so that you could compare.
And after a while you will see the result. Let’s say that, for example, 10% of people who saw the red button, bought a bouquet. And of these who saw the green one, 20% bought.
Clearly, the green one is a winner here! Yay! Go green!
What does “the best” mean?
Let’s see step by step what you did there.
First, you said “which button is the best”. What does “the best” mean?
In the case of selling flowers, you want to see how many people came to your website. Some people may go away after taking a look, but the others will buy a bouquet.
The ratio of everyone vs buyers is called “conversion”. And it’s a metric you, as a business owner, probably would like to use to understand if the new button color is better or worse.
What metrics make sense to use?
Conversion is one example, but is A/B testing useful for something else?
Of course it is.
It all depends on what your business wants your customers to do. If you want to collect emails to reach your customers later, then the number of emails submitted would be the best metric. If you need people to log in, then the number of log-ins. If you want them to post a photo, use that. Anything you need to do, and you can measure, you can use an A/B test for.
Here are some business metrics you can consider:
- Conversion
- Click-through rate
- Log-ins
- Sign-ups
- Bounce rate
- Submitted content (photos, articles, reviews of your product).
What additional metrics can I use?
To better understand your customers’ behavior on your website or in your app, you can use a number of additional metrics .
Log and measure everything you can!
Then you can analyze this data and see some interesting stuff. For example, if you notice that people who scroll down the page more than the others, end up buying a flower more often. Great! Next time, when changing something on the page, you’ll want to watch how it affects this behavior. If the change is going badly, and people don’t scroll down a lot, but close the page right away – you know why. Now you can start thinking: how does my change prevent people from looking at my beautiful flower list and scroll down.
Here are some metrics you can use to understand the behavior better:
- User clicked/hovered/interacted with your element
- User clicked on a different element – to check if your new element draws user’s attention too much
- Time the user spent on the page
- Scrolled down
- Looked through the list
- Filled a field
- Selected an item; or selected several items.
These metrics are not business metrics – meaning that in the end your business doesn’t care so much about where exactly users click. You want to look at these metrics to understand your customers better, with the ultimate purpose to drive your business metric.
Building a hypothesis
But why did you change the button in the first place? Most likely, you had a good reason in mind, something like last trends in the industry, making the button aligned with the rest of the design, making it more visible or less aggressive? This is called a hypothesis.
A hypothesis can be just one sentence, or it can be much longer. In any case, the general structure is similar to this:
If I implement X,
the users will do Y,
and it’s good because Z.
So, our hypothesis for the button in the flower shop may look like this:
If I paint the button green, instead of red,
the users will find the button more easily and click on it more,
and it’s good for my business because they will buy more flowers.
I’m going to try another hypothesis for this article:
If I add a cat to my article,
the readers will say AAAaaw,
and it’s good because they will remember my article.

In case of success
Let’s call it “success” when the new color is better than the other. (Note that I’m saying “better” here – remember that it means “better on your business metrics”.)
Right, so you’ve changed your button color, and saw the new color winning over the other. What’s next?
- First of all, you celebrate your achievement! Bring chocolates or a pizza to your team, congratulate them, they’ve done a great job and deserve some praise.
- Where else can I apply the same approach?
You want to start thinking what other red buttons you want to paint green. Now you have a strong case for doing so, right? - Continue on topic.
You might start thinking: since my customers react so strongly to this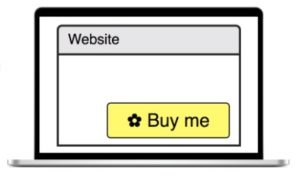 softer button color, this must be a very important button. Maybe there is another color I could try at the same place. How about yellow? And maybe a little flower icon on it?
In case of failure
Now, let’s talk about the failure. Let’s call it “failure” when the new color is performing the same or worse on your business metric.
Don’t worry! It didn’t all go to waste. You learned a lot about your customers. Analyze the results you have and learn from them. Let’s say you tried blue color – and the customers hated it, the flower sales went down. Well, that’s unfortunate, but let’s stay optimistic and use this opportunity to learn. Next time you won’t use it anymore, when adding a new button somewhere on the same page.
And don’t give up! You just learned something about your customers: since they react so strongly to this button color, this must be a very important button, and we can have a great effect changing it. So how about we try something else with it? If they like the color as it is… how about making it bigger?
And if they don’t react at all, well, you just learned not to waste your time here anymore. Go on and experiment on something else.
Learning is the most important thing
Just to remind you how important it is: learning is the most important thing.
Why is that?
You are never sure if your experiment will be successful. If you knew for sure, you wouldn’t bother with running an experiment. You would just implement your feature without any ado. (There is nothing wrong with this, many businesses do this, and it is perfectly fine depending on your domain area and you customer requirements.)
But since you decide to run an experiment, you don’t know the result.
And whatever the result is, you learned something about your customers. They don’t like red buttons? Perfect, next time you won’t paint another button red. You just learned this important thing for the price of some lost purchases, but now you are informed and won’t lose any more purchases in the future.
Long-term you will value learnings about your customers a lot.
Repeat
In both cases, whether it is a success or not, you learn and repeat. Learn the most you can from all metrics you’ve been collecting and apply your new knowledge: repeat your experiment in the best way possible.
Try several times. If you have several unsuccessful tries, you will be pretty sure there is nothing to catch, and move on to another idea. But it’s too early to give up after just one try.
So, I am going to repeat my cat experiment again.

5 Steps to an experiment
So, let’s go through the whole process again, to recap.
- First, you build a hypothesis. “If I paint the button green, my customers will buy my product more often because green button is more visible”.
- Then, you choose metrics you’re going to use. Conversion, number of log-ins, sign-ups, etc.
- After that, you implement the experiment and run it.
- Then, you analyze the results. Success? Great, I will apply this elsewhere. Failure? Great, I just learned.
- And repeat.
And when not to run A/B tests?
Check this write-up to know what features are best to be implemented without A/B tests.